How Digital is the EU in 2015?
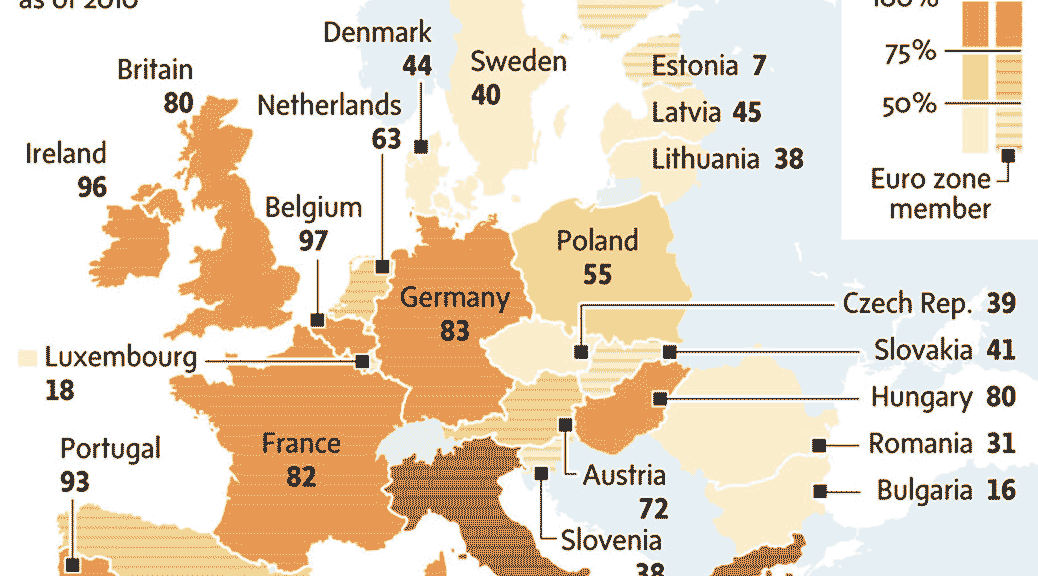
How Digital is the EU in 2015? The European Commission has published new data analysing and ranking how digital EU member states are. The Digital Economy and Society Index
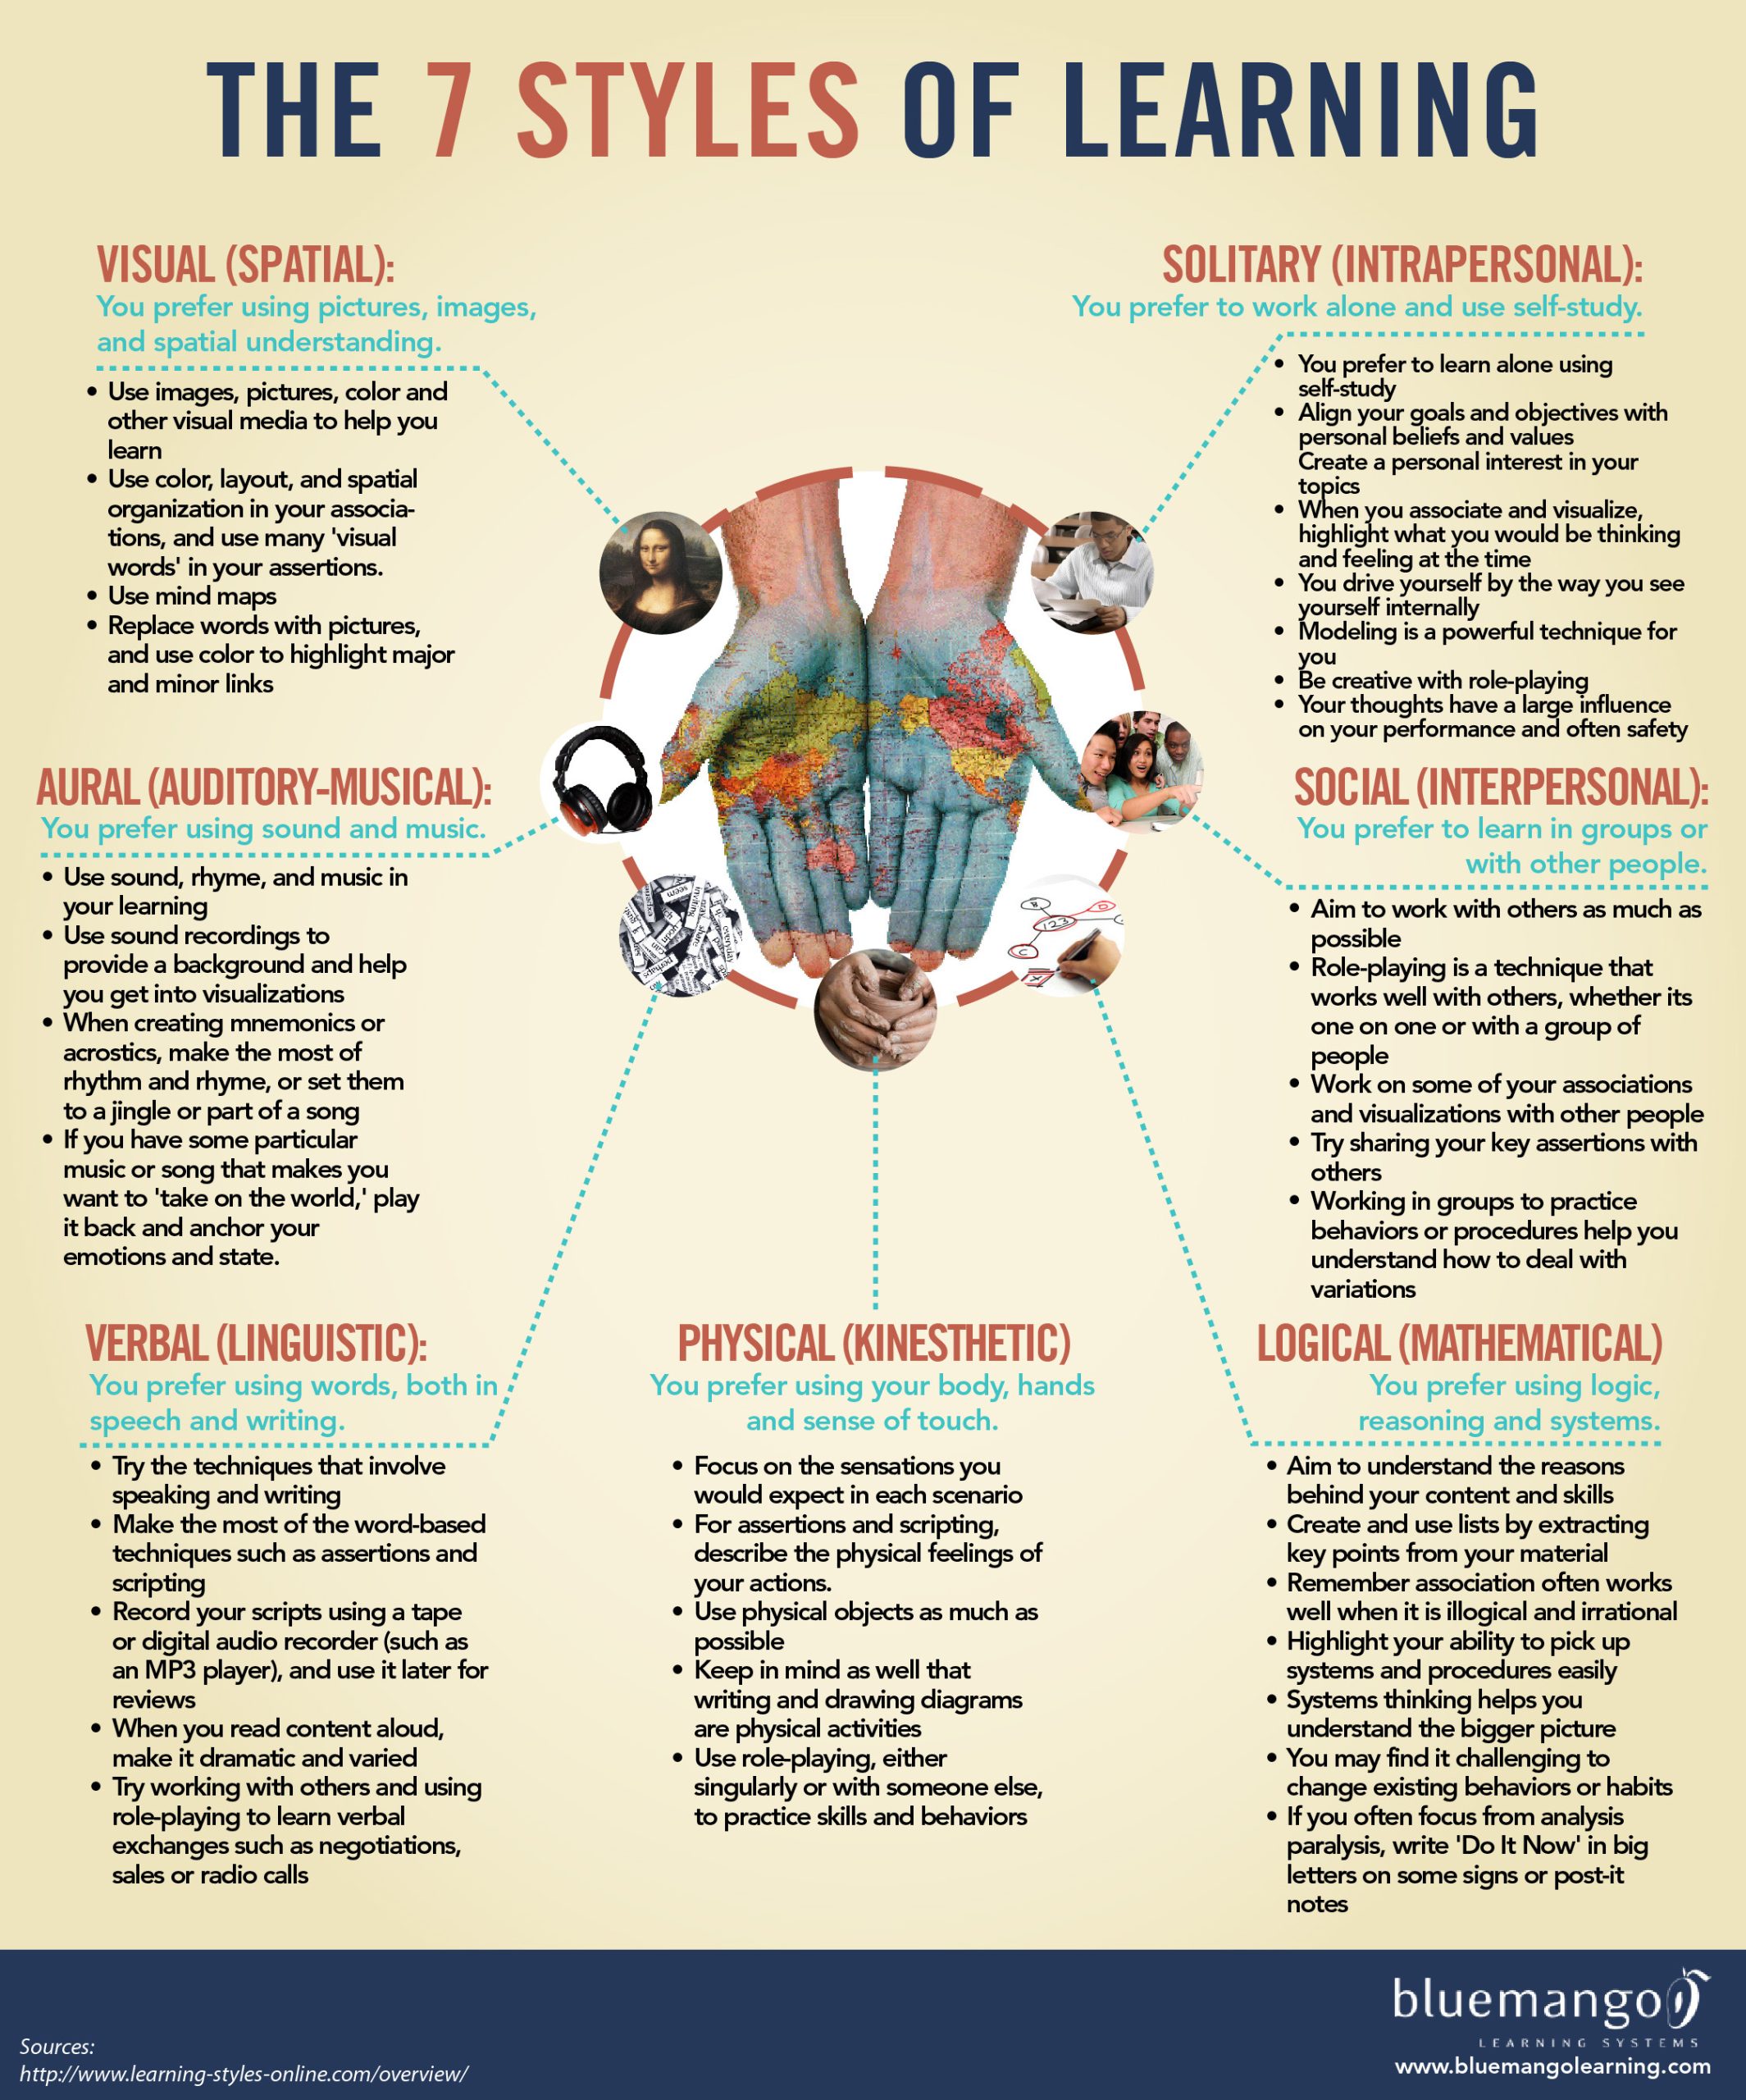
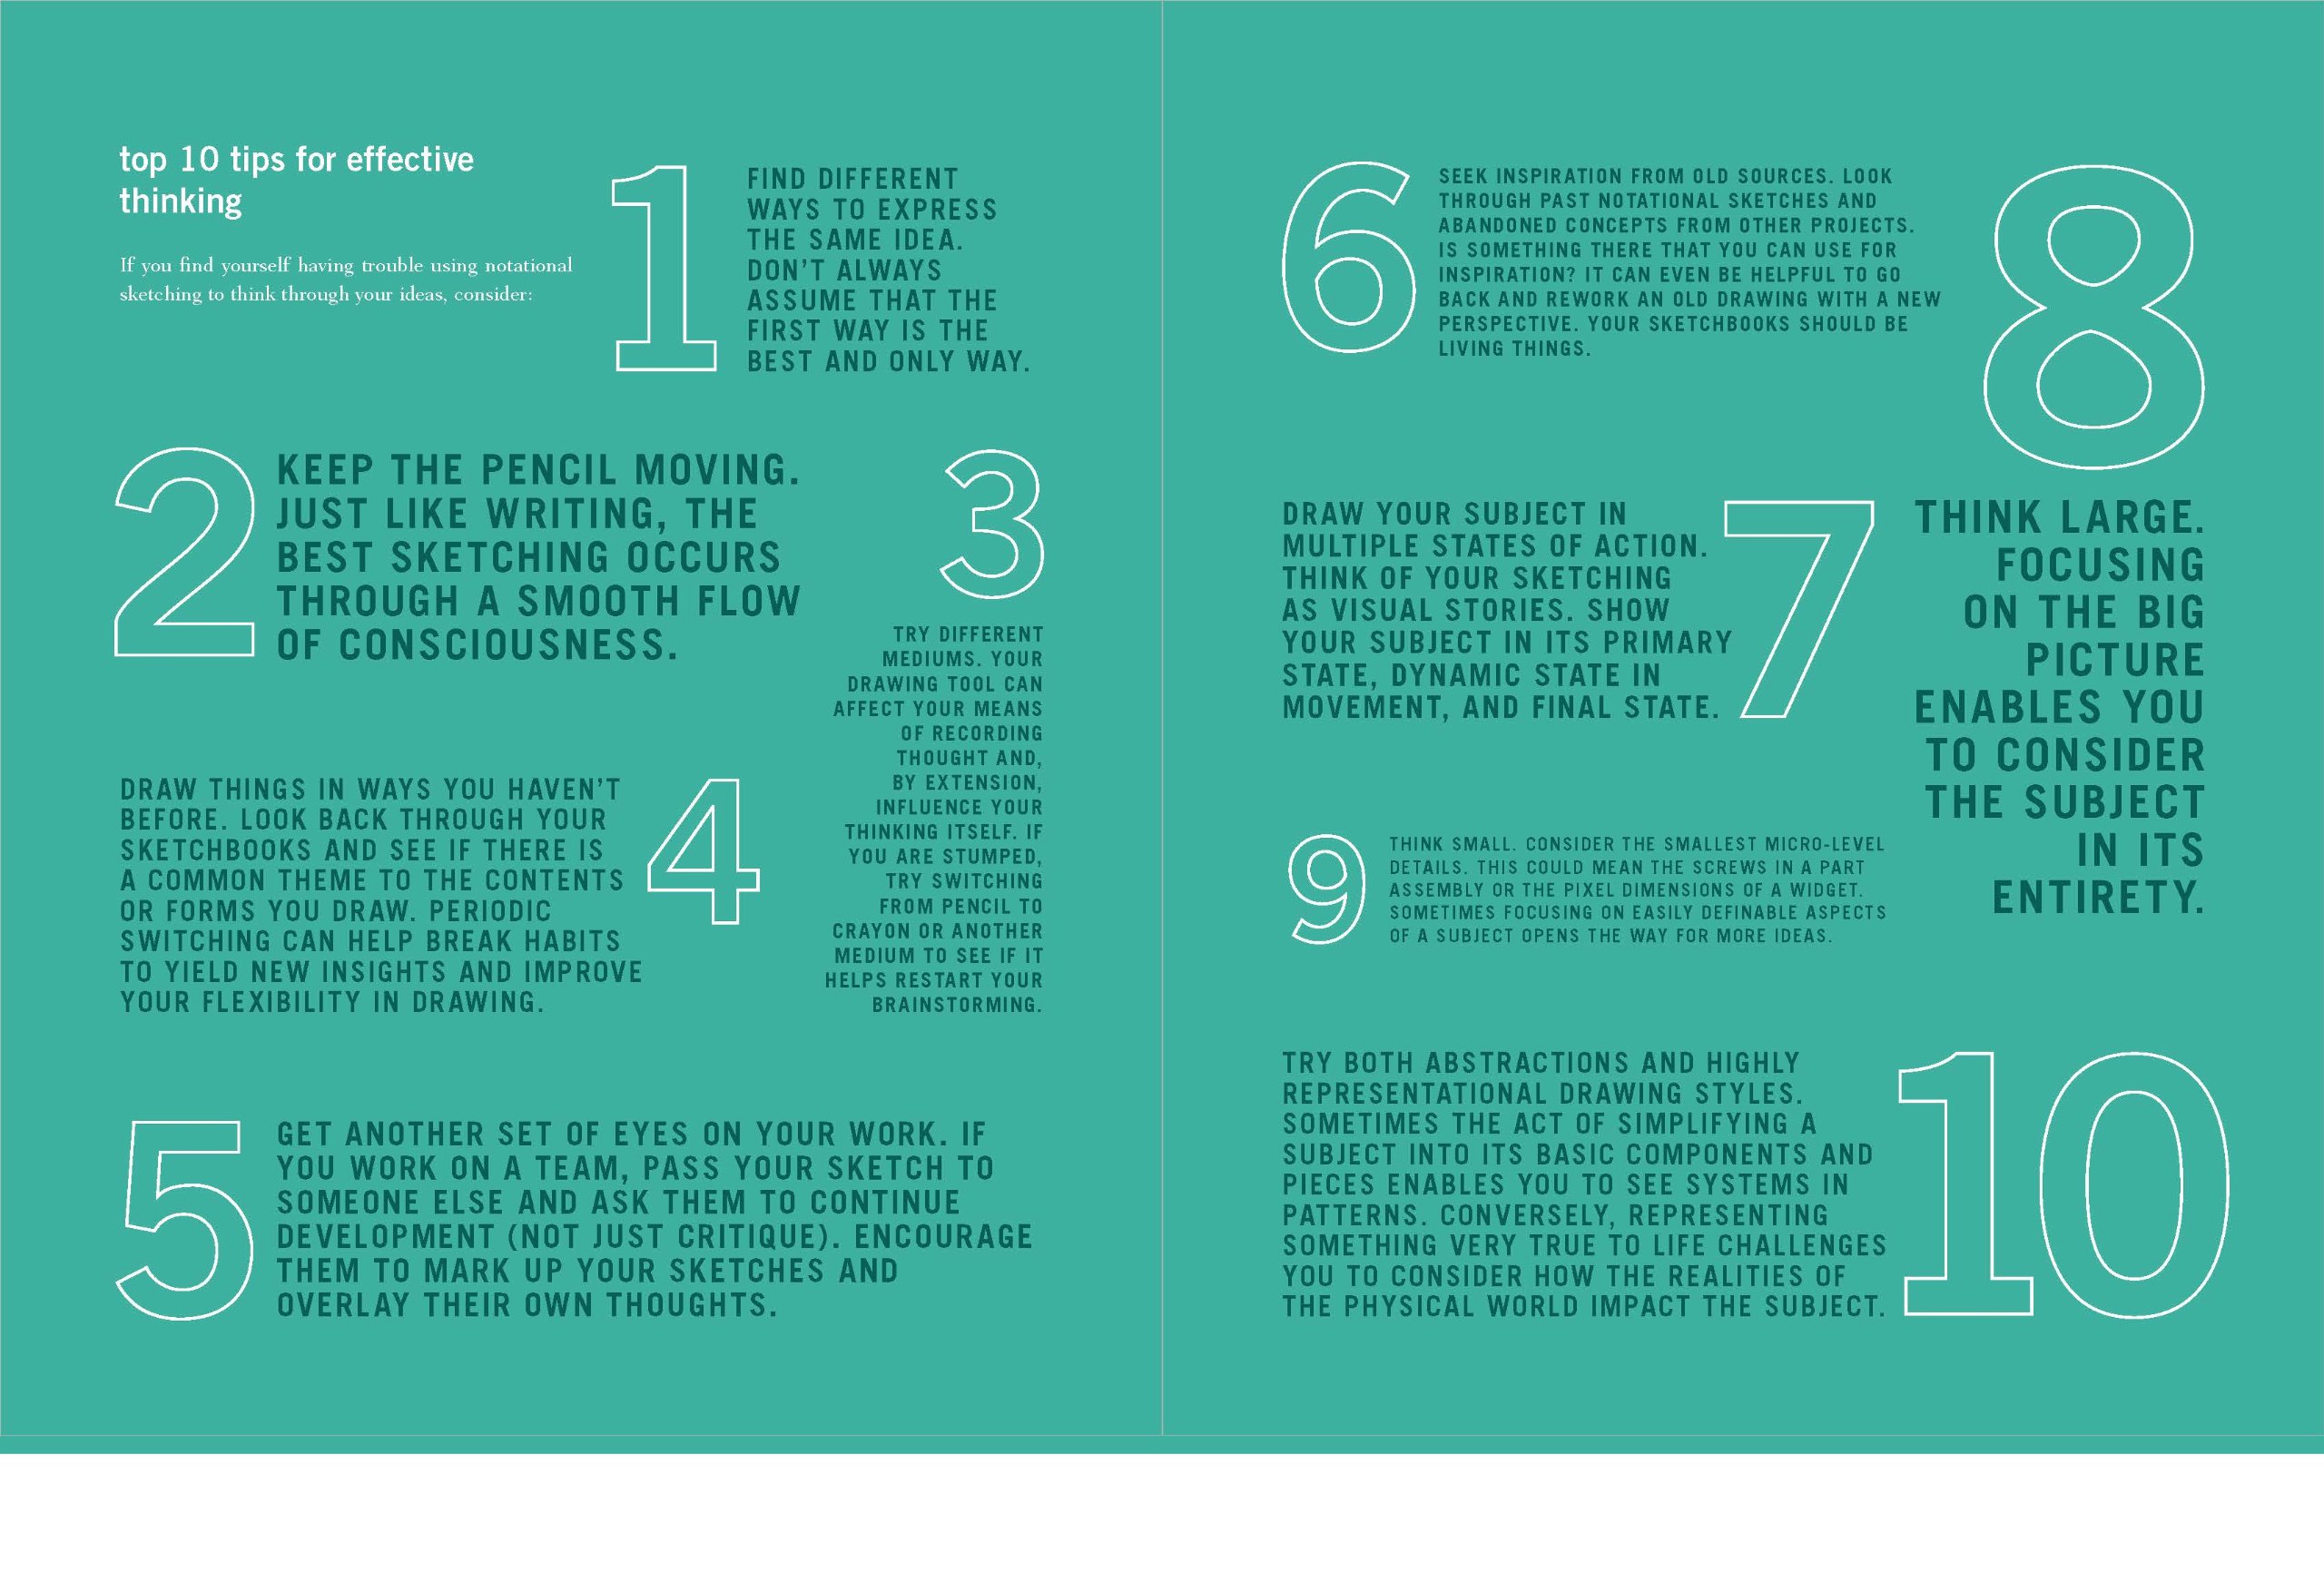
Learning styles in education are the systematic differences in individuals' natural or habitual pattern of acquiring and processing information in learning situations. A core concept is that individuals differ in
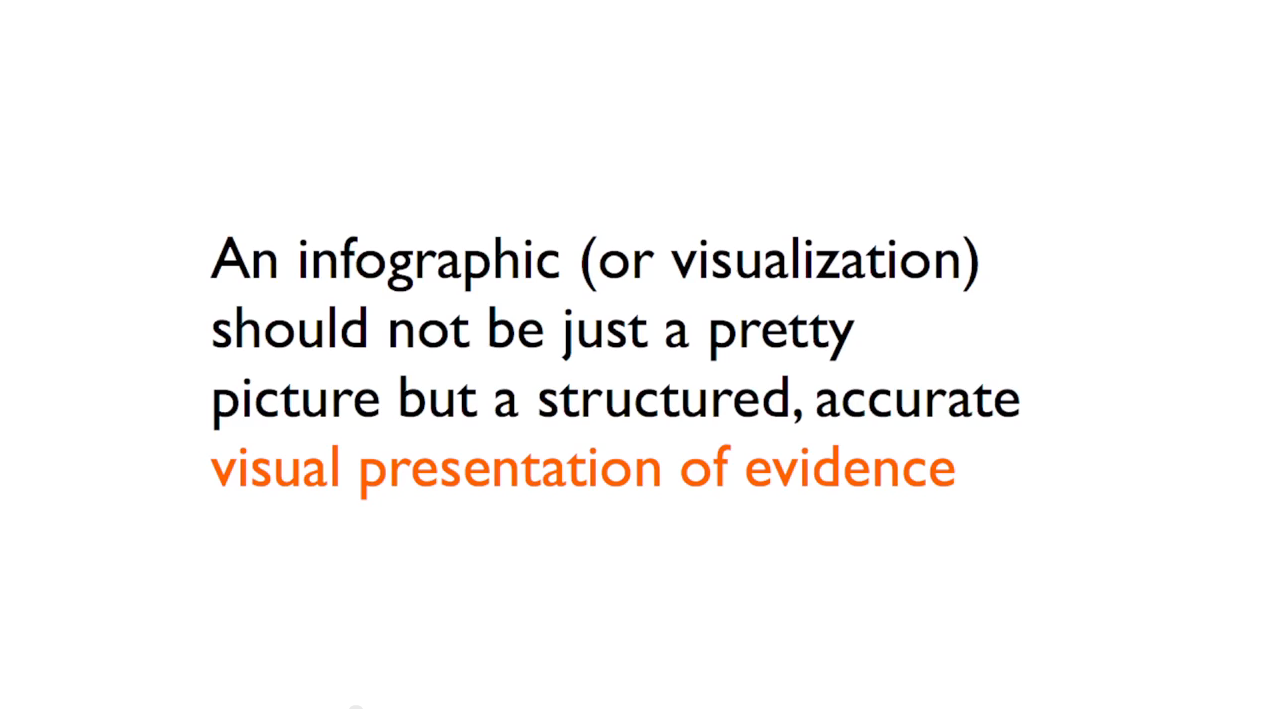
"Too many journalists still relate the word "design" to making pages and websites look prettier. As a consequence, they think that the main goal of an infographic is to be
Van 26 feb. tot 20 mei 2014 was er in de British Library de tentoonstelling Beautiful Science te zien. Van klassieke diagrammen (uit hun eigen collectie) tot hedendaagse digitale weergaves onderzocht deze tentoonstelling hoe data visualisatie bijdraagt aan nieuwe
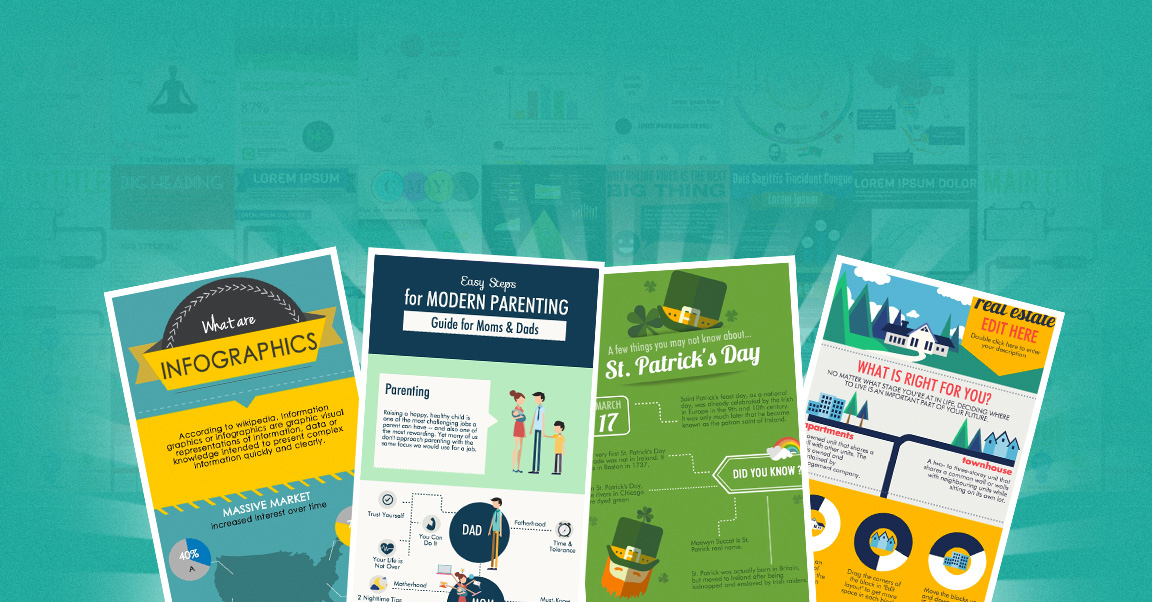
Piktochart is an easy infographic design app that requires very little effort to produce beautiful, high-quality graphics. Make your infographics here.
Door de snelle ontwikkelingen in de veranderende maatschappij is er steeds meer ruimte voor innovatieve denkers die hun vernieuwende ideeën effectief kunnen overbrengen. Het vermogen om die ideeën niet alleen in tekst
Op woensdag 2 november 2011 werd door de Bijzondere Collecties van de Universiteit van Amsterdam een uniek evenement georganiseerd rond het 25-jarig bestaan van Mijksenaar bv. Op deze middag werden
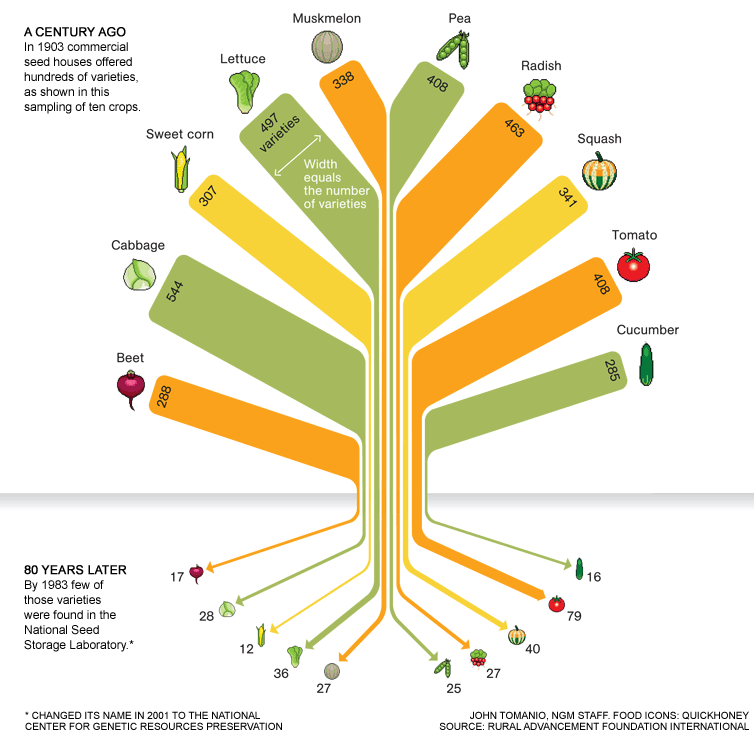
Bron: The Globa and Mail
Het is even zoeken hoe de navigatie van de interactieve tijdslijn werkt maar dan werkt het best prettig. Vooral de link naar gekoppelde artikelen maakt het een waardevolle lijmlaag voor