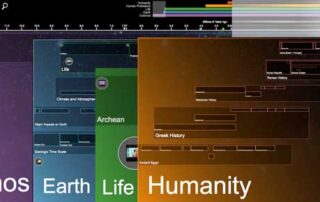
ChronoZoom, a tool for visualising big history
You can browse through all of history on ChronoZoom to find data in the form of articles, images, video, sound, and other multimedia. ChronoZoom links together a wealth of information
"Too many journalists still relate the word "design" to making pages and websites look prettier. As a consequence, they think that the main goal of an infographic is to be
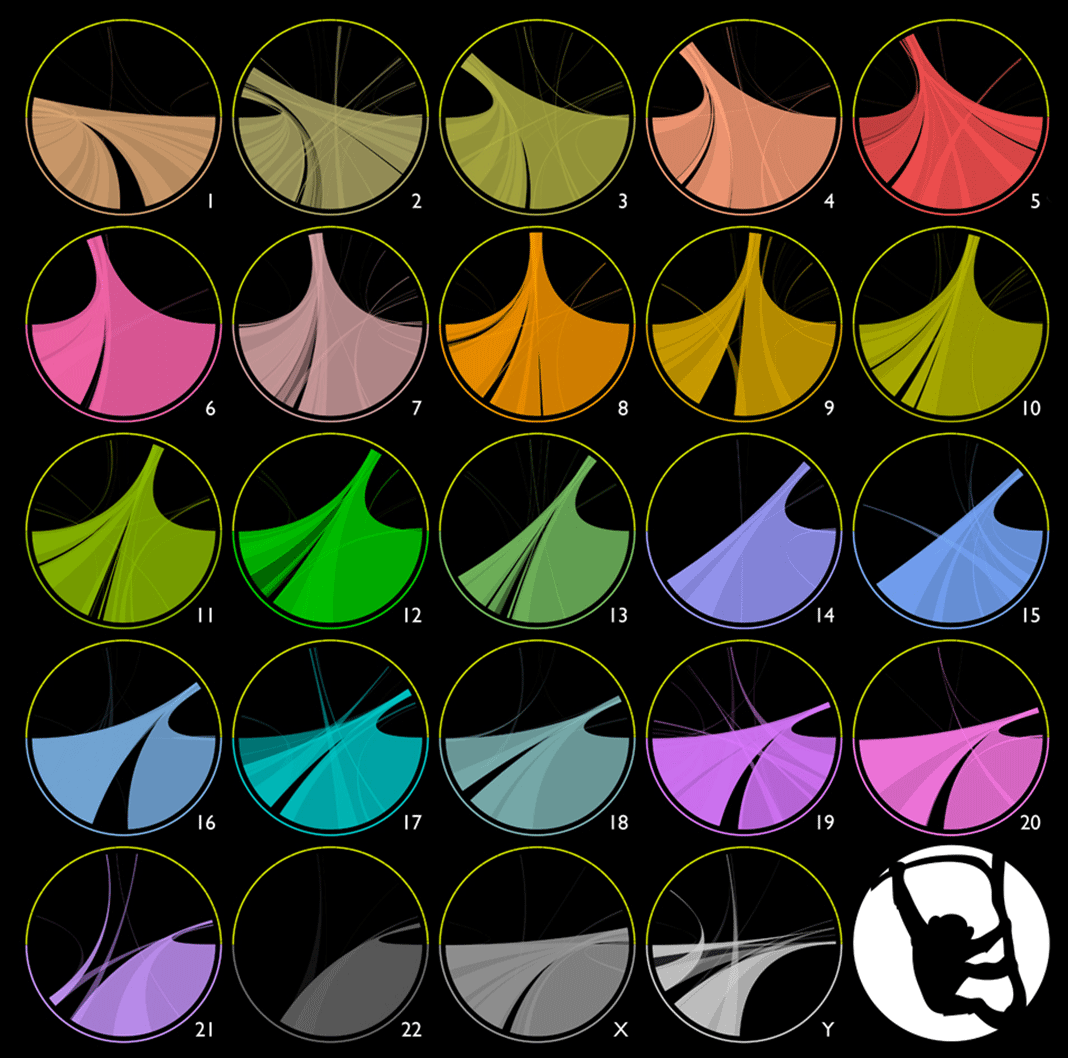
Van 26 feb. tot 20 mei 2014 was er in de British Library de tentoonstelling Beautiful Science te zien. Van klassieke diagrammen (uit hun eigen collectie) tot hedendaagse digitale weergaves onderzocht deze tentoonstelling hoe data visualisatie bijdraagt aan nieuwe
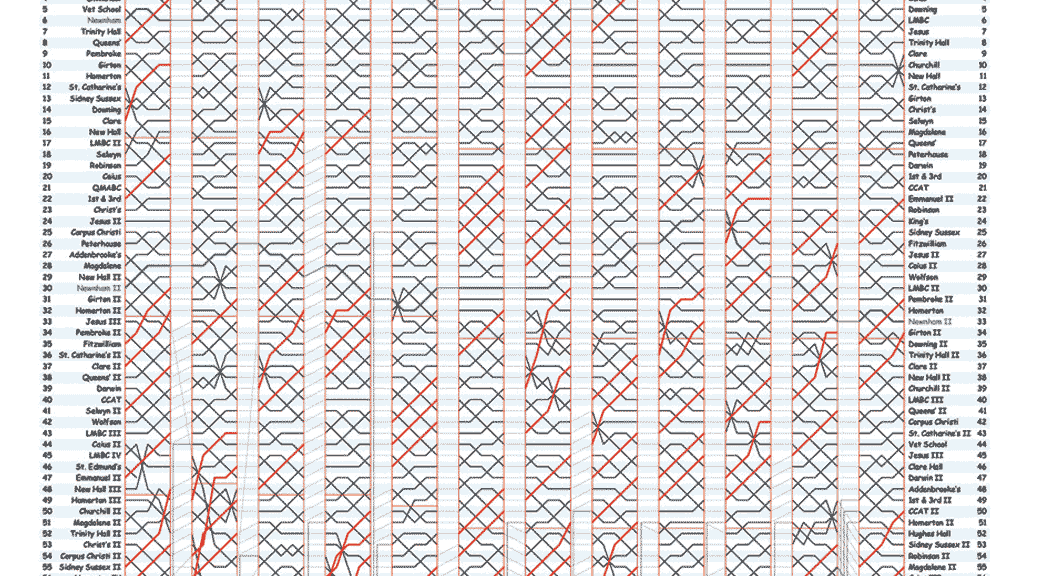
Charlie Park, besteed in het artikel Edward Tufte’s “Slopegraphs” aandacht aan slopegraphs - wat zijn het, hoe zijn ze gemaakt en waarom worden ze nog steeds niet veel toegepast.
© Illustrated by Merchant for the Brunswick Review Joshua Yaffa van de Washington Monthly heeft een prachtig artikel geschreven over Edward Tufte, de man die data en informatie visualisatie naar
Travis Kochel heeft, als vingeroefening, het font Chartwell ontwikkelt waarmee je direct data kunt visualiseren. Verander je de input verandert het diagram, de data blijft dus te bewerken. Het idee
Jan Schwochow van Golden Section Graphics heeft een droom verwezenlijkt. Samen met een creatief team heeft hij het nulnummer van In Graphics op de markt gebracht. Het tijdschrift presenteert presenteert
Assuming you’re not working for a media corporation with huge graphics and statistics departments at your disposal, you may want to create some infographics for your own articles. With today’s
Het prachtige project Rotterdam Open Data initieert projecten om publieke data over Rotterdam te ontsluiten. Data is de bron van informatie, door data op een zinnige manier te koppelen en
De BBC heeft recentelijk 'The Joy of Stats' uitgezonden. Een prachtige documentaire waarin de liefde van Hans Rosling voor het visualiseen van statistieken van het scherm spat. Online is deze