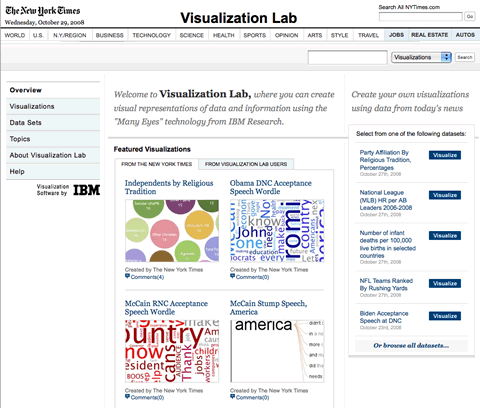
A specially for The New York Times developed version of Many Eyes can be used to create visualizations using data from today's news. Users of the website will be able to visualize and comment on information and data sets presented by the NYTimes. They can share those visualizations with others and create topic hubs where people can discuss specific subjects.
Why is the Times working with IBM to distribute Many Eyes on NYTimes.com? Like the creators of Many Eyes at IBM's Visual Communication Lab, The Times believes that users could bring their insight to the process of interpreting data and information and discovering new and innovative ways of presenting them. Just as readers' comments on articles and blogs enhance our journalism, these visualizations - and the sparks they generate - can take on new value in a social setting and become a catalyst for discussion.
The New York Times Visualization Lab
Personally I think it's positive that users can see visualizations of data. It can give more insight in the accompanying news articles. But offering users the opportunity to use that many visualization options is very distracting and leads to nothing.


Leave a comment